Groundwater contour maps are indispensable to environmental reports where groundwater is being investigated, namely Phase II and Phase III Environmental Site Assessments. Remediation efforts hinge on accurate flow interpretation; misjudging the hydraulic gradient can lead to ineffective or misdirected clean-up strategies. In this context, the value of contour maps extends beyond mere technical documentation — they are central to risk assessment, compliance, and responsible environmental stewardship.
For groundwater contour models, the method used to interpolate data between sampling points is crucial, and more often than not one method is the best. Let’s break down some common gridding methods:
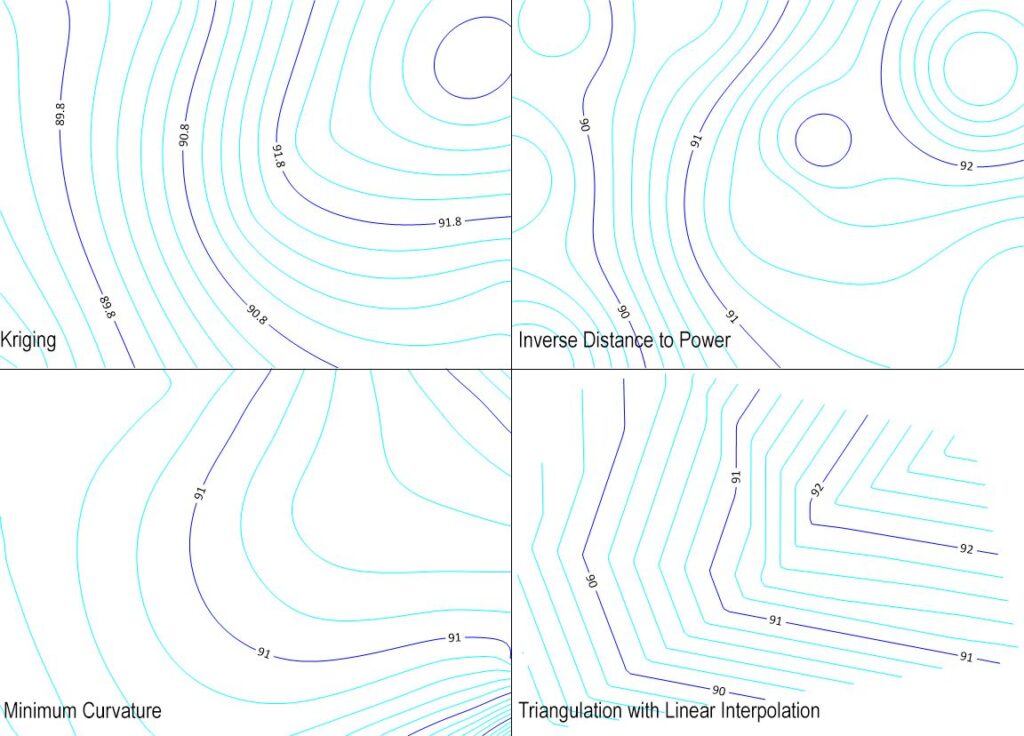
𝐊𝐫𝐢𝐠𝐢𝐧𝐠: Most common, most reliable. This method doesn’t just consider the distance between points but also their spatial relationship and how that relationship changes over distance. It provides not only an interpolated value but also an estimate of the error or uncertainty at each point, which is incredibly valuable for risk assessment.
𝐈𝐧𝐯𝐞𝐫𝐬𝐞 𝐃𝐢𝐬𝐭𝐚𝐧𝐜𝐞 𝐭𝐨 𝐚 𝐏𝐨𝐰𝐞𝐫 (𝐈𝐃𝐖): Simple. Quick. Assumes that data points closer to the interpolated location have more influence. The influence decreases with distance, raised to a specific power. IDW does not account for spatial autocorrelation (how related data points are to each other). Can create undesirable “bullseye” patterns around sampling points.
𝐌𝐢𝐧𝐢𝐦𝐮𝐦 𝐂𝐮𝐫𝐯𝐚𝐭𝐮𝐫𝐞: This method generates a smooth surface that passes through all data points. It works by minimizing the total curvature of the surface, similar to stretching a rubber sheet over the data points. Can sometimes create visually pleasing surfaces but doesn’t have a statistical basis.
𝐓𝐫𝐢𝐚𝐧𝐠𝐮𝐥𝐚𝐭𝐢𝐨𝐧 𝐰𝐢𝐭𝐡 𝐋𝐢𝐧𝐞𝐚𝐫 𝐈𝐧𝐭𝐞𝐫𝐩𝐨𝐥𝐚𝐭𝐢𝐨𝐧 (𝐓𝐈𝐍): This method connects the data points to form a network of triangles. The surface is then created by linearly interpolating values within each triangle. It’s a good option for irregularly spaced data, as it ensures the surface passes directly through the data points, but it can create sharp, unnatural edges where triangles meet.